Interactive Koala Map
How might we provide an interactive way to view detected organisms using AI?
Header photo by Joseph Pérez on Unsplash
Background
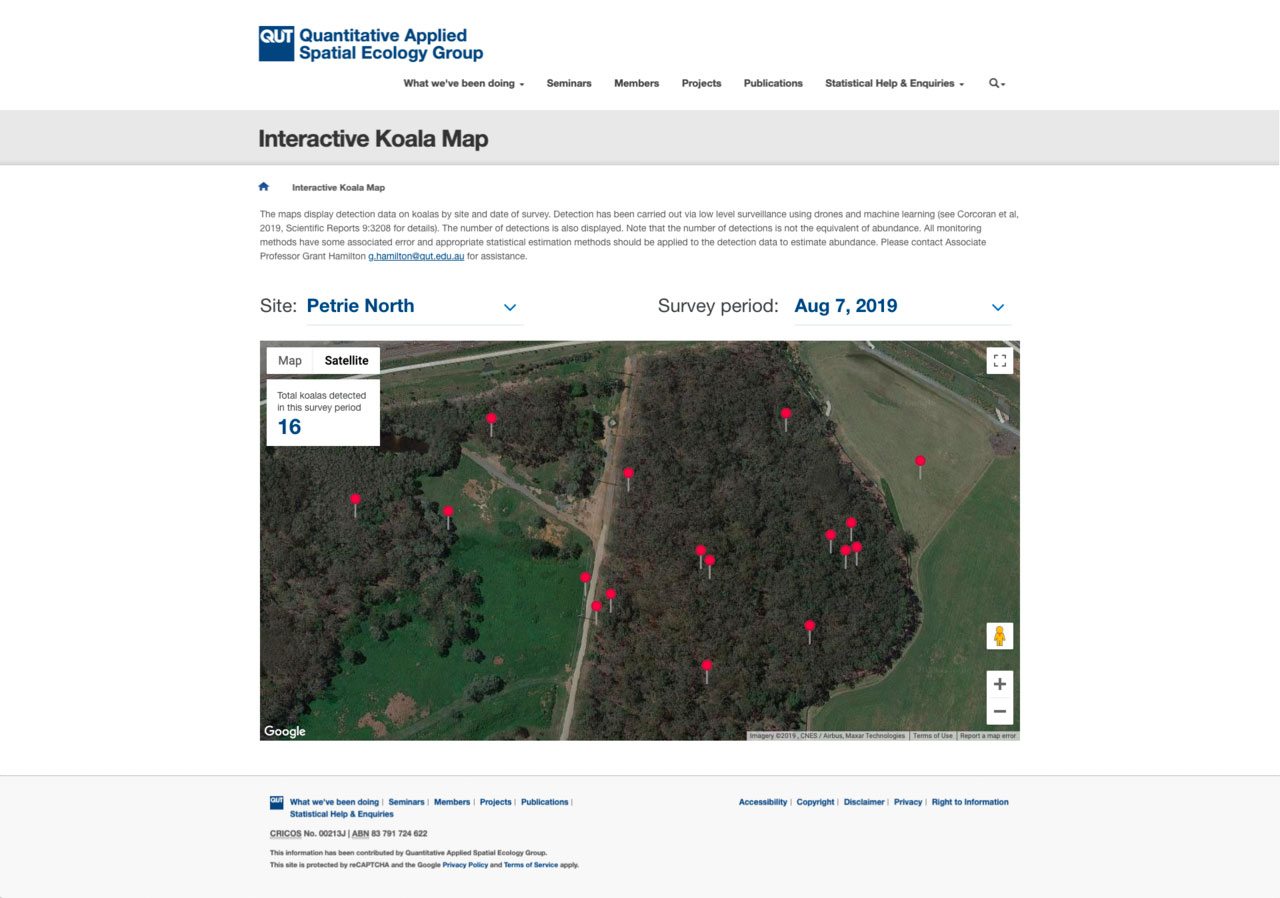
The requirement for this project was to create an easy-to-use interactive map which shows the location of koalas detected using thermal imaging in a given area at different points in time. The interactive map is a way for visitors to the Quantitative Applied Spatial Ecology Group (QASE) to view the work done by the group to detect specific organisms (in this case, Koalas) using UAVs and artificial intelligence. The interactive map is required as part of State Government grant outcomes and will serve as part of a future ARC Linkage proposal with Lone Pine Koala Sanctuary.
Role: UI/UX Designer
Methods and Tools: Usability Testing, Wireframing, Prototyping, Adobe XD, Adobe Illustrator
Team members: Stakeholder, Product Owner, a Scrum Master, a Business Analyst, and 3 Developers.
Goals
- Highlights the research done by QUT in environmental research, attracting PhD students and serving as part of a future ARC Linkage proposal with Lone Pine Koala Sanctuary.
- Accurately represent the number of koalas detected at different points in time and allow for trend estimation for koala abundance in a given area.
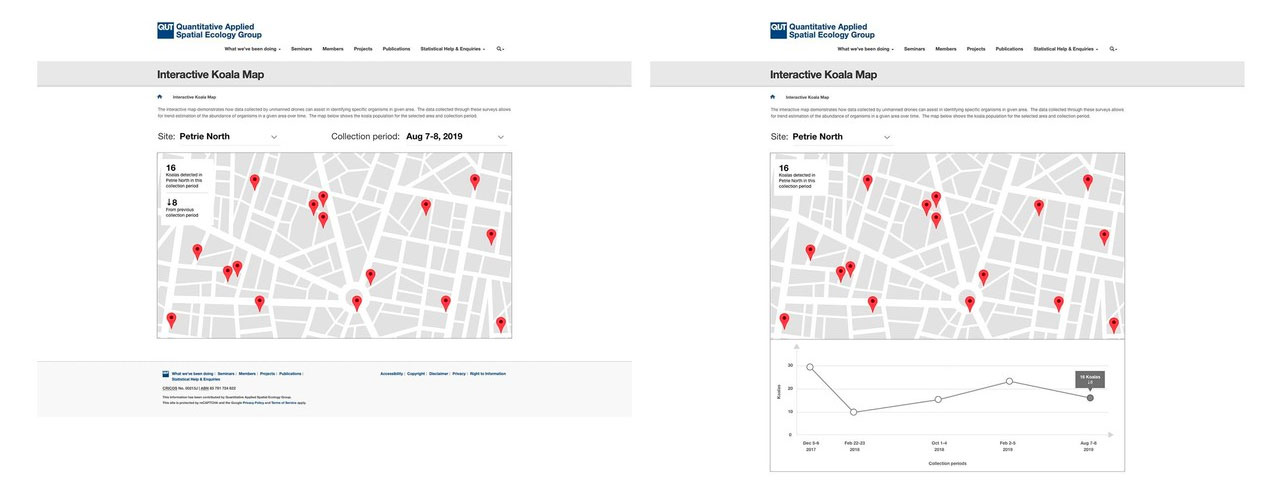
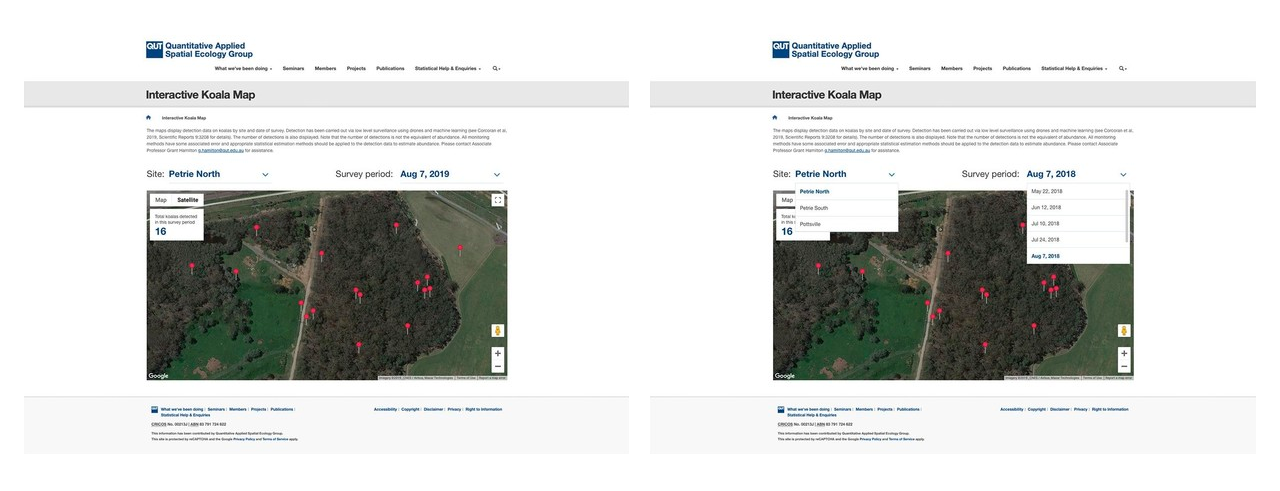
Wireframing
Once we met with the Stakeholder to gather requirements, I mocked up a few wireframes to create an interactive prototype. Discussing with the Developers the technical capabilities, we had a number of iterations to work through some of the complex interactions.